

Stackpit: a Tiny Self-Hosted Sentry
A drop-in, self-hosted replacement for Sentry's event ingestion and browsing. Single binary, single SQLite file, no external dependencies.
Self-hosting the official Sentry means standing up PostgreSQL, ClickHouse, Kafka, and Redis before it will even boot. That’s a lot of infrastructure to run and keep healthy, and for most of what I use error tracking for, it’s more backend than the job needs. What I actually want is ingestion, grouping, and a way to browse errors.
So I built Stackpit: a drop-in, self-hosted replacement for Sentry’s event ingestion and browsing. One binary, one SQLite file, no external dependencies. Point your existing Sentry SDKs at it, browse errors in the web UI, or query the JSON API.
“Lighter” here means lighter to run, not lighter in what it can take. On a single laptop with the default SQLite backend it sustains around 10,800 events/s with zero rejections; tune the write batch and it holds well into the tens of thousands, and PostgreSQL fans ingestion out across writers for another 2-3x on top. So it’s a fine fit for large projects too, not just small ones, and I’m still working to push that ceiling higher. More on the numbers below.
What it looks like
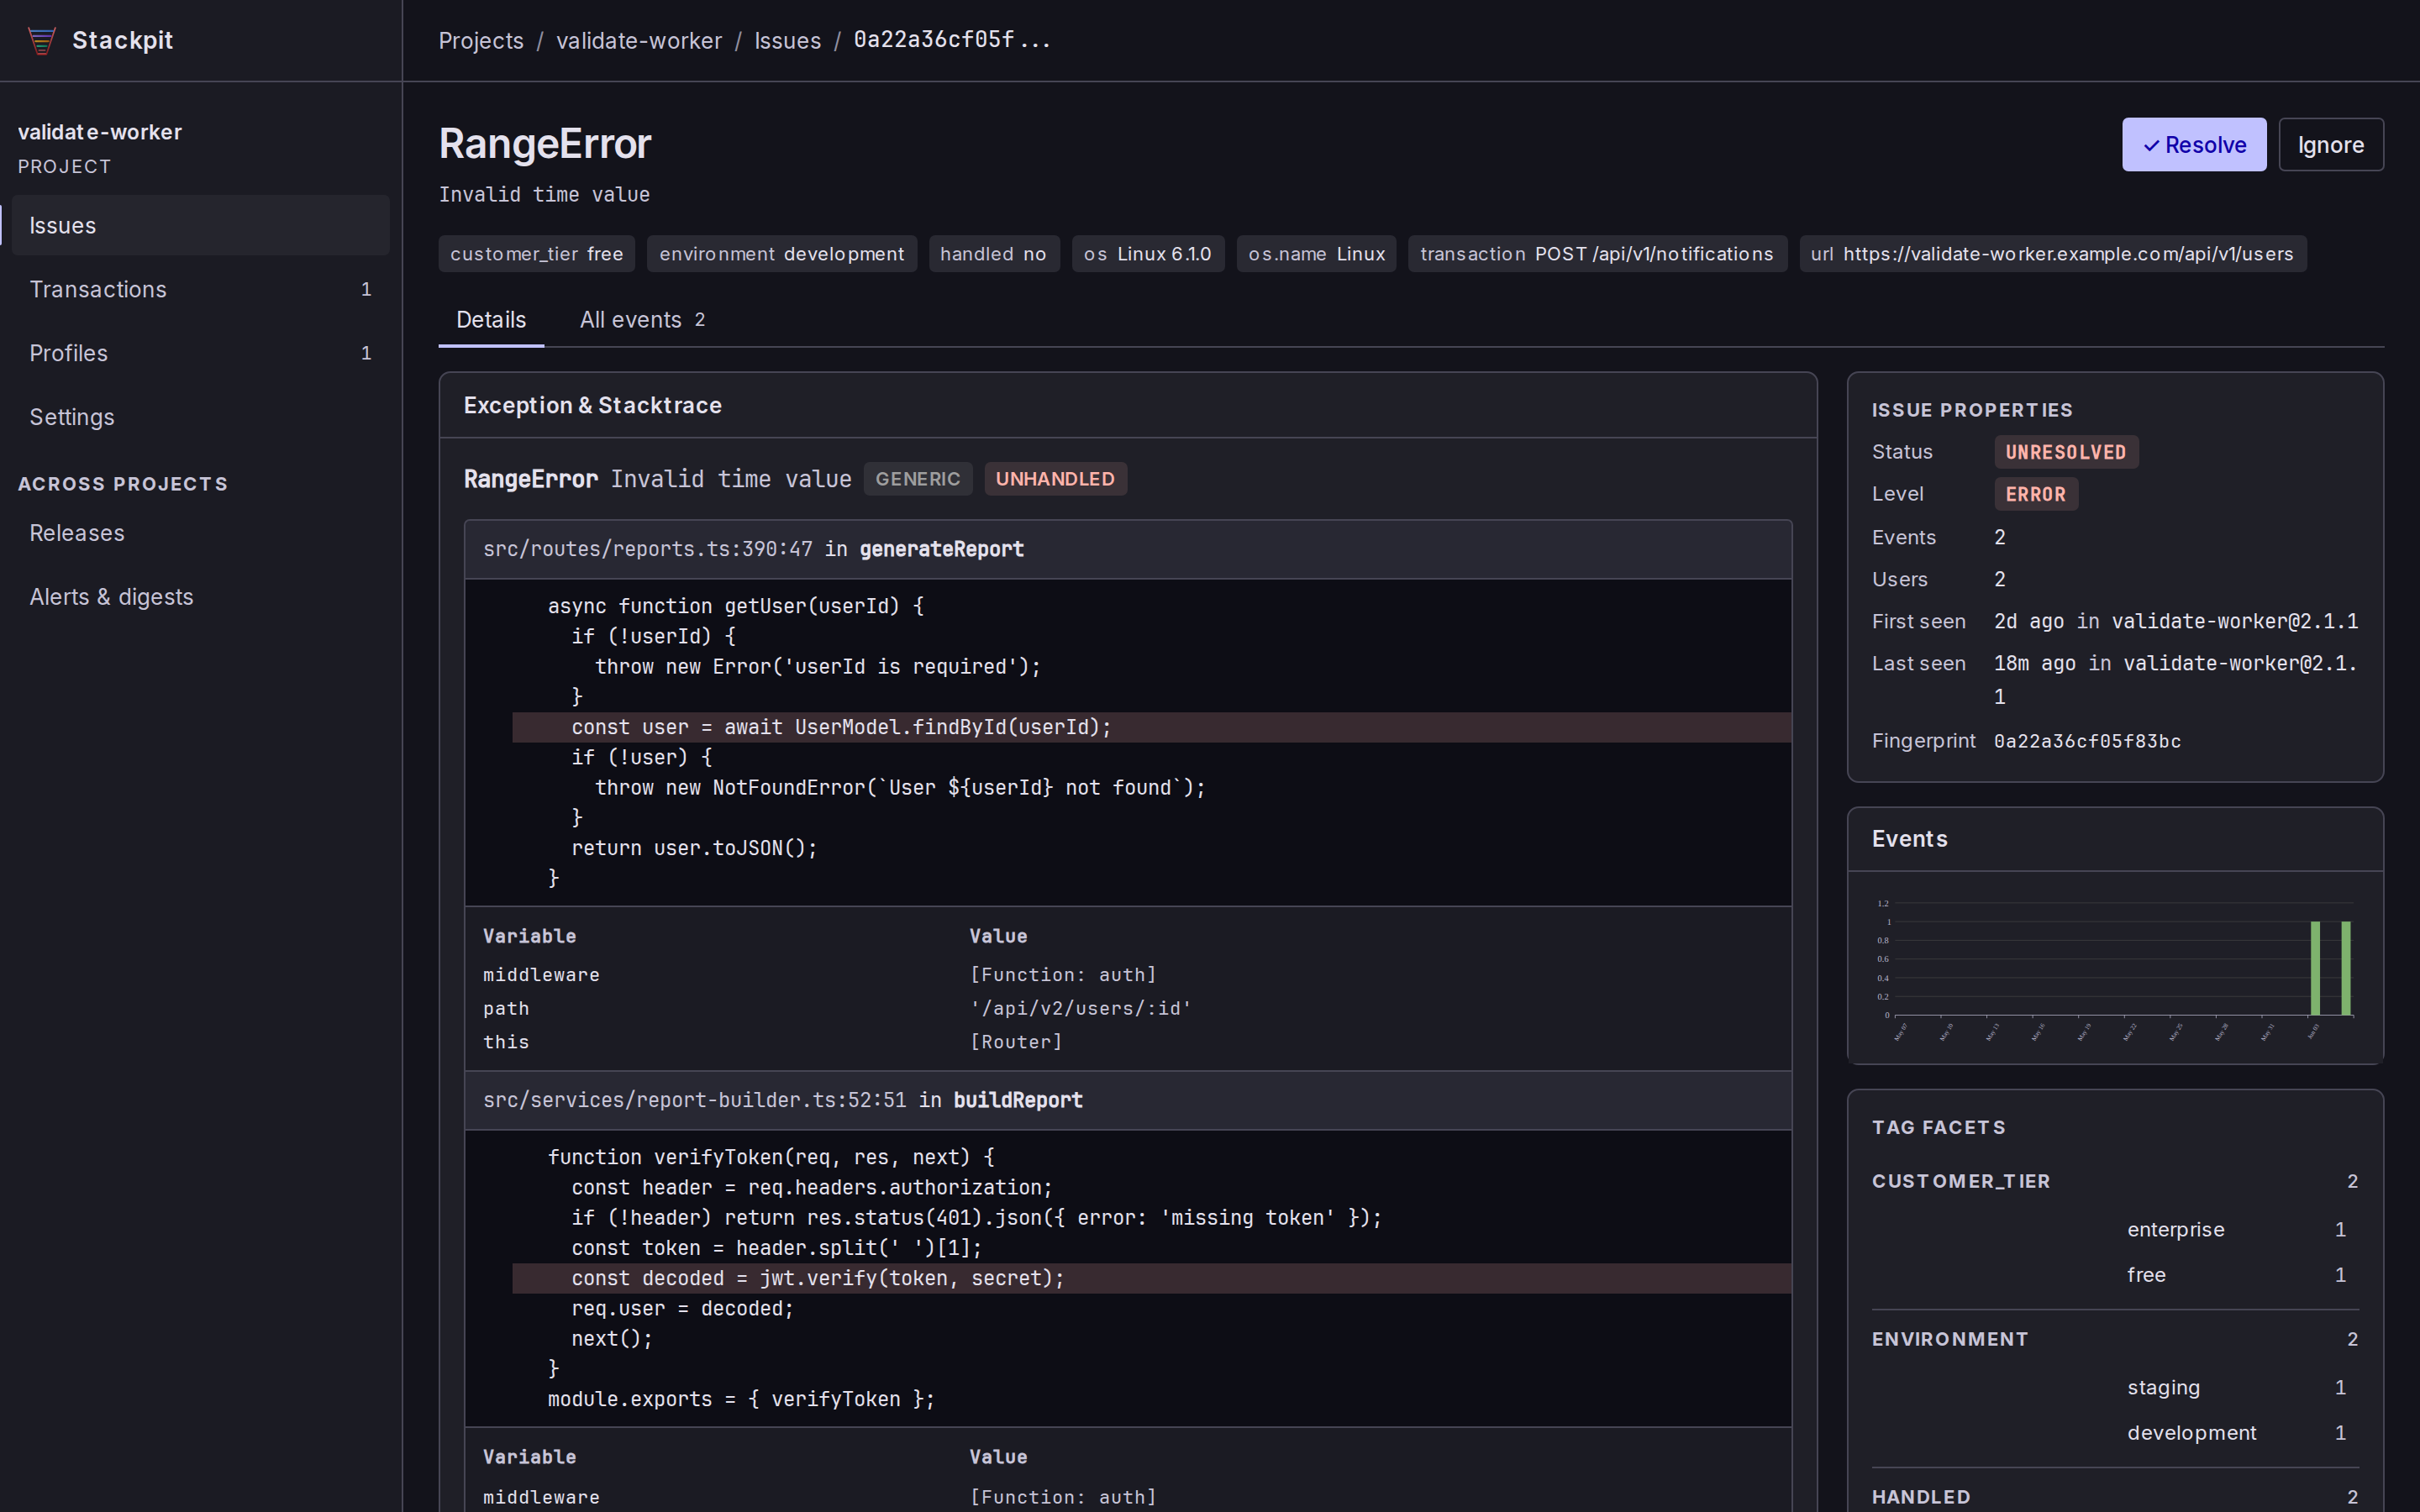
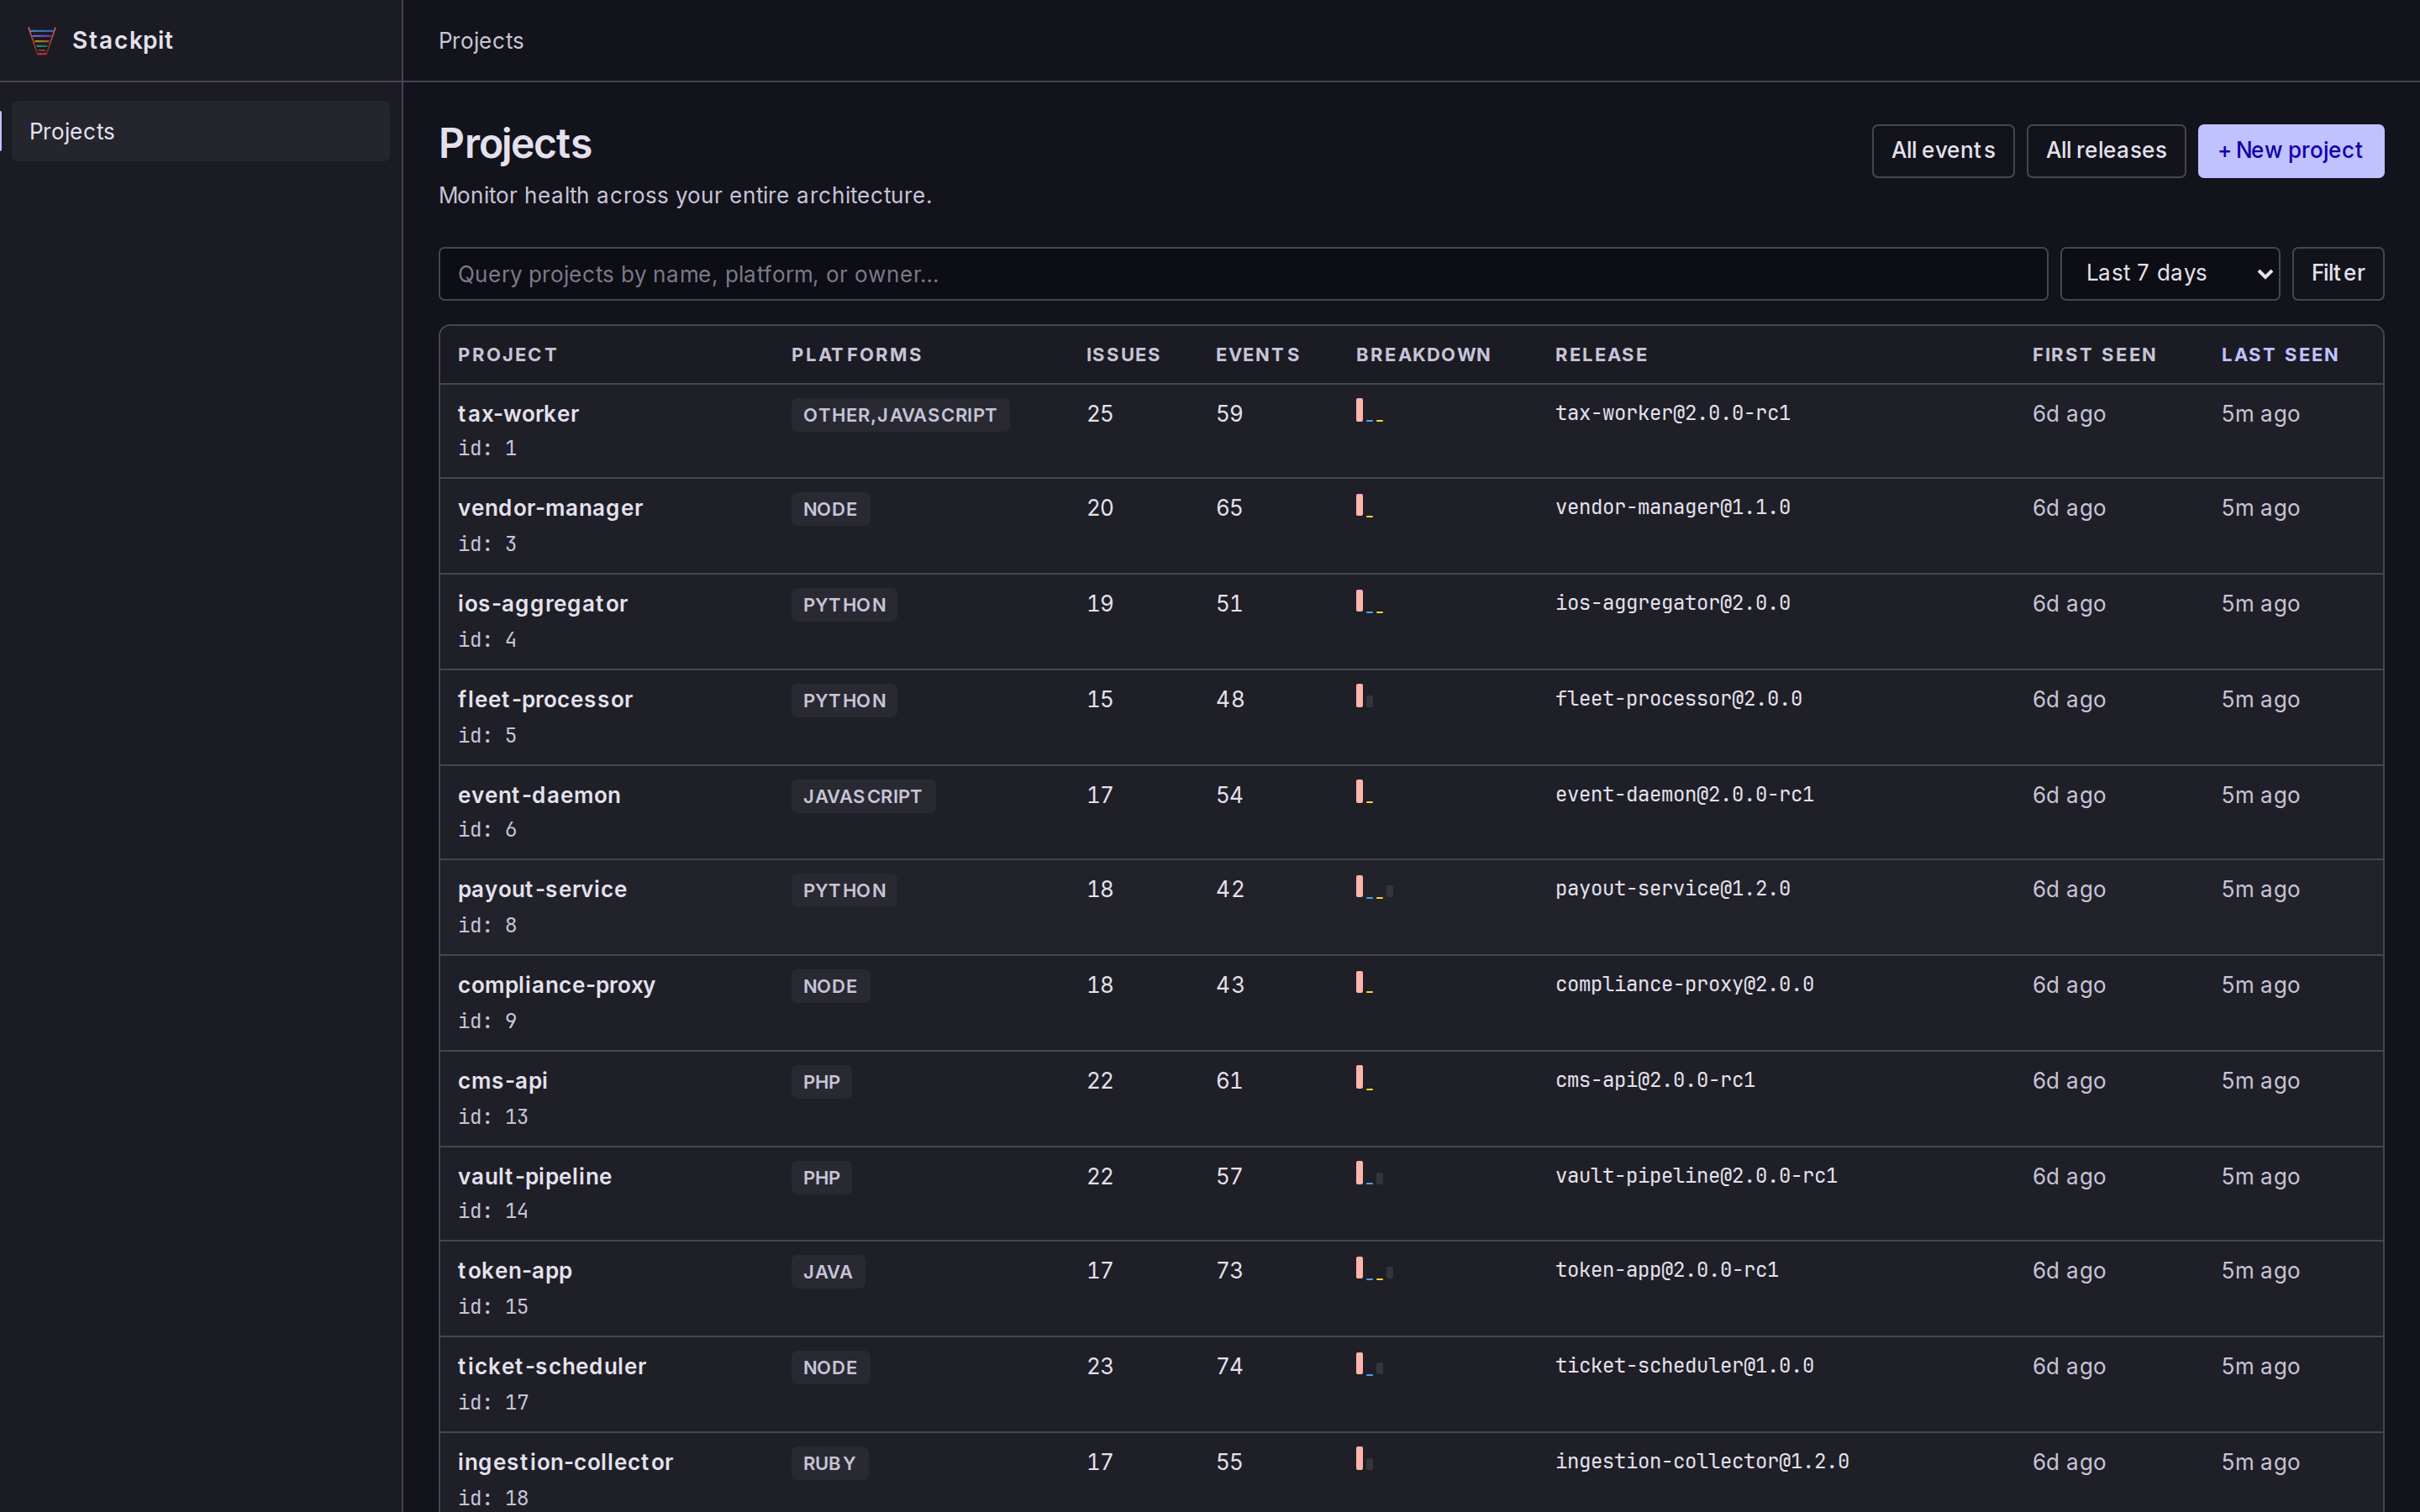
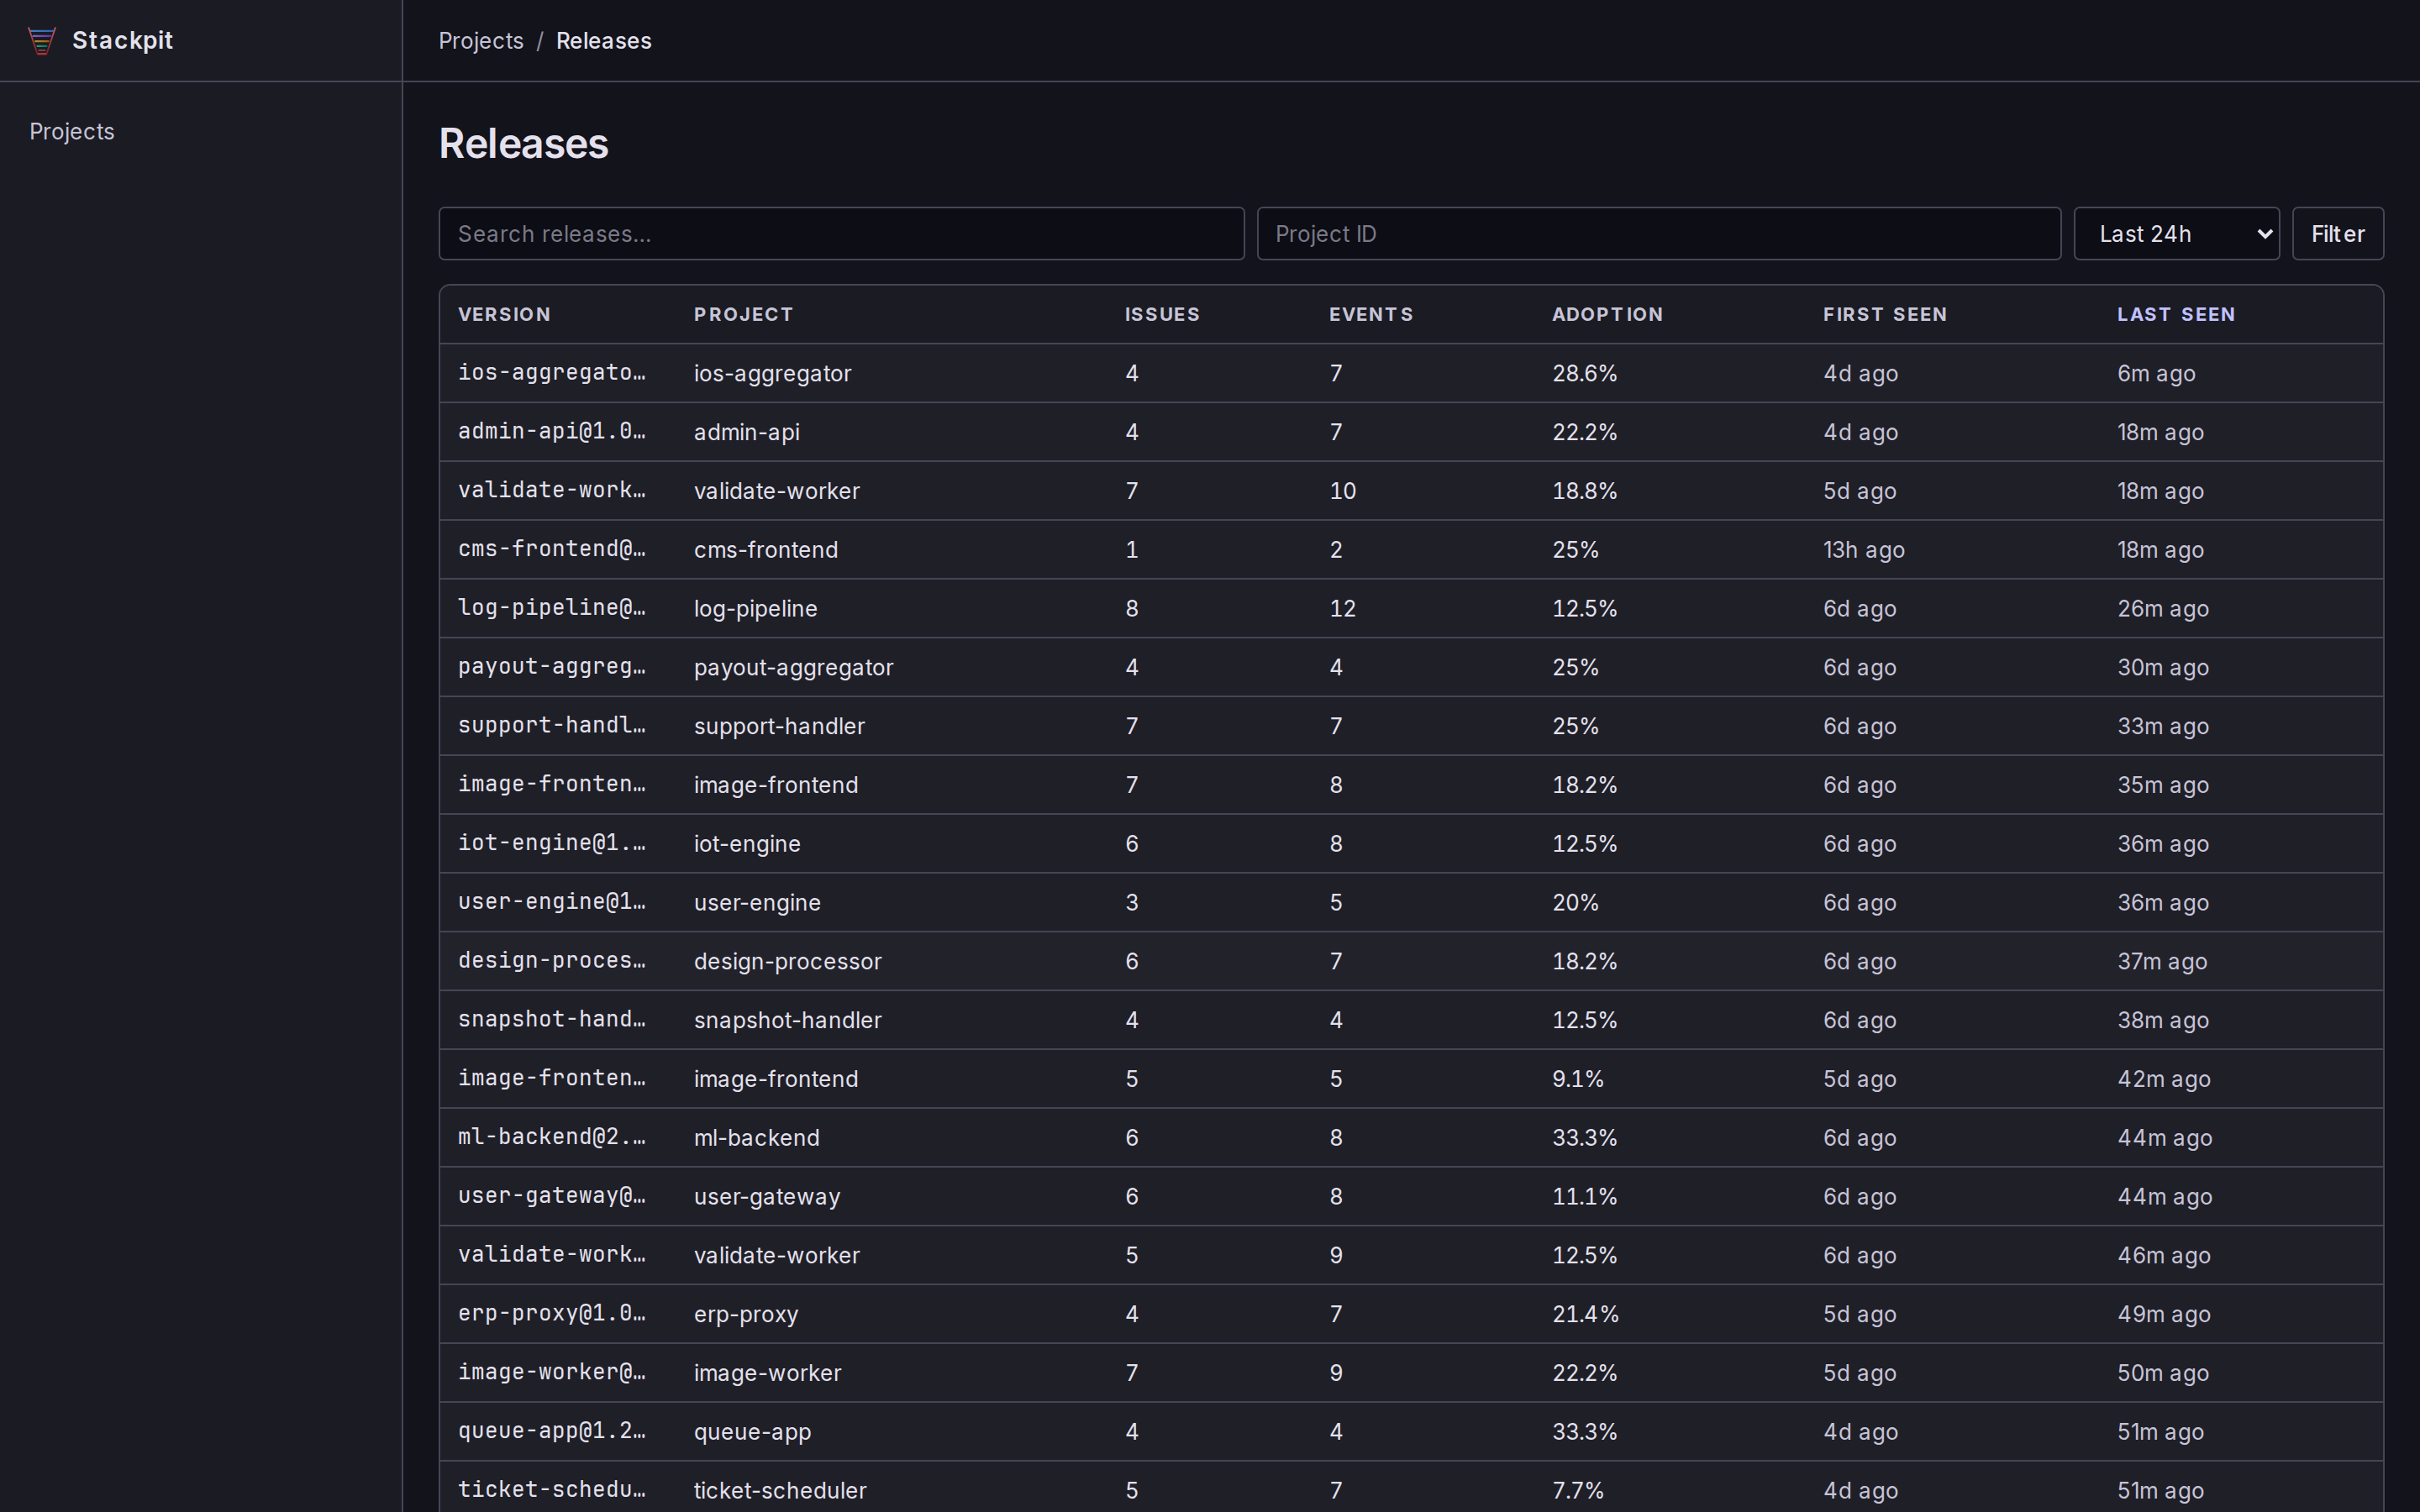
You get a server-rendered web UI to browse issues, events, transactions, logs, traces, and releases. No SPA, no build step, just pages. Click any screenshot to enlarge.
How fast is it?
Throughput hasn’t been the thing I worry about. Here’s one run on a laptop (Ryzen 5 7640U, SQLite backend, ~2.9 KiB error envelopes, with the load generator stealing the same cores):

ingest_batch_size |
Sustained (5 min, zero rejections) | Burst |
|---|---|---|
| 2000 (default) | ~10,800 events/s | 12,000-13,000 events/s |
| 10000 | ~15,000-18,000 events/s | ~20,700 events/s |
The default config holds 10,800 events/s for a five-minute soak with zero rejections, accept latency p50 1.7 ms / p99 6.9 ms. Push past the knee and it sheds the excess with HTTP 503 backpressure rather than dropping anything silently. Raising the write-batch size trades a bigger all-or-nothing commit for more headroom, into the low 20,000s in bursts. And that’s SQLite with a single writer: on PostgreSQL, ingestion fans out across writer tasks for another 2-3x.
These are single-machine numbers, so take them with a grain of salt. The repo ships the stackpit-bench load generator if you want to run your own.
What’s in the box
- Drop-in Sentry protocol. Envelope and legacy store endpoints, all auth methods. Any Sentry SDK works, no code changes. You just swap the DSN.
- Single binary, no dependencies. One process, one SQLite file, or PostgreSQL instead if you’d rather. It’s one or the other, picked up front: there’s no migration between them.
- Issue grouping. Fingerprint-based, with regressions and resolution tracking.
- Some performance and tracing. Transaction percentiles, throughput, failure rates, span waterfalls, Web Vitals, and release-health crash-free rates. Basic, but useful.
- Notifications and alerts. Email (Lettermint, Postmark, or SendGrid), Slack, and webhooks, with digests and threshold rules.
- Source maps. Upload via
sentry-cliso minified traces resolve to original source. - Cron monitors. Check-in tracking via Sentry’s protocol.
- Auth your way. A shared admin token for solo use, or OAuth/OIDC SSO for teams, with self-serve organizations and roles.
- Migrate in. Pull historical events, issues, and releases from an existing Sentry instance.
Stackpit vs Sentry
Stackpit covers the everyday error-tracking workflow and a bit of performance monitoring, then stops short of Sentry’s heavier features. Here’s roughly how they line up (accurate as of today):
| Capability | Stackpit | Sentry |
|---|---|---|
| Error ingestion (Sentry protocol, any SDK) | Yes | Yes |
| Issue grouping, regressions, resolution | Yes (own fingerprinting) | Yes (richer heuristics) |
| Source maps | Yes | Yes |
| Releases and release health (crash-free users/sessions) | Yes | Yes |
| Performance monitoring | Basic (percentiles, throughput, failure rate) | Full APM |
| Distributed tracing | Basic (span waterfalls) | Full |
| Web Vitals | Yes | Yes |
| Logs | Yes | Yes |
| Cron monitors | Yes | Yes |
| Session replay | Stores/browses what the SDK sends | Full player |
| Profiling | View-only | Full |
| Alerts (email, Slack, webhook, digests, thresholds) | Yes | Yes |
| Auth / SSO | Admin token + OAuth/OIDC | Yes |
| Organizations and roles | Self-serve orgs, per-org scoping, owner/member, invites, IdP claim mapping | Yes |
| Deployment | Single binary, one SQLite file | Many services (PostgreSQL, ClickHouse, Kafka, Redis) |
| Storage backend | SQLite or PostgreSQL | PostgreSQL + ClickHouse + Kafka |
| License | MIT, self-hosted | SaaS or heavy self-host |
The gaps are deliberate: if deep APM, full-fidelity replay, or profiling are load-bearing for you, run the real thing.
Running it
It’s a single self-contained binary (or a Docker image), so you can… just run it: stackpit init writes a config with a fresh admin token, then stackpit serve starts it. The full walkthrough, the Docker variants, and the other install routes (.deb, .rpm, Homebrew, cargo install stackpit, Guix) live in the README, so I don’t have to keep two copies in sync.
Where to get it
There’s a product page with the highlights, and it’s MIT-licensed with the code, releases, and docs on GitHub at github.com/franzos/stackpit. The README has the full comparison table, and the Operator Guide covers everything past first boot: PostgreSQL, OIDC/SSO, connecting SDKs, notifications, source maps, monitors, and syncing from an existing Sentry instance.
That’s the trade I was after: robust enough to sit in front of a real workload, but boring to set up and boring to run. No cluster to stand up, nothing to babysit, just a binary and a config file.